quantilope launches Category Twins: synthetic consumers built on your own tracking data - March 2026
As the newest early-stage innovation in our quantilabs hub, think of Category Twins like having a 24/7 focus group where you can have real-time, back-and-forth questions as if you’re directly speaking with consumers that represent your unique target audience (built on your own Better Brand Health Tracking data).
Participating quantilabs customers will have instant, anytime access to Category Twins that represent various segments of their audience — like brand buyers or heavy category users. As they conduct ongoing research, they’ll be able to lean on their Category Twins for a variety of business needs, such as:
➖Concept Testing: "Would you try a body wash for sensitive skin?"
➖Competitive Analysis: "What do you associate with Brand X vs. Brand Y?"
➖Hypothesis Testing: "If we launched a men's line, would that surprise you?"
quantilope’s Category Twins unlock a new dimension of early-stage research by being:
✅ Credible: Built on evidence-based metrics like Mental Availability and Category Entry Points (CEPs) from the Ehrenberg-Bass Institute (the gold standard for brand growth).
✅ Custom: Powered by your own brand tracking data, each of your Category Twins is unlike any other.
✅ Current: Category Twins will update automatically with every new wave of your tracking study so you always have the most current insights, even as the market shifts.
The future of insights isn’t just about having the data — it’s about having the conversation.
To learn more about quantilope's Category Twins, please reach out to your quantilope team!
quinn is now a fully end-to-end Integrated AI Research Partner! - February 2026
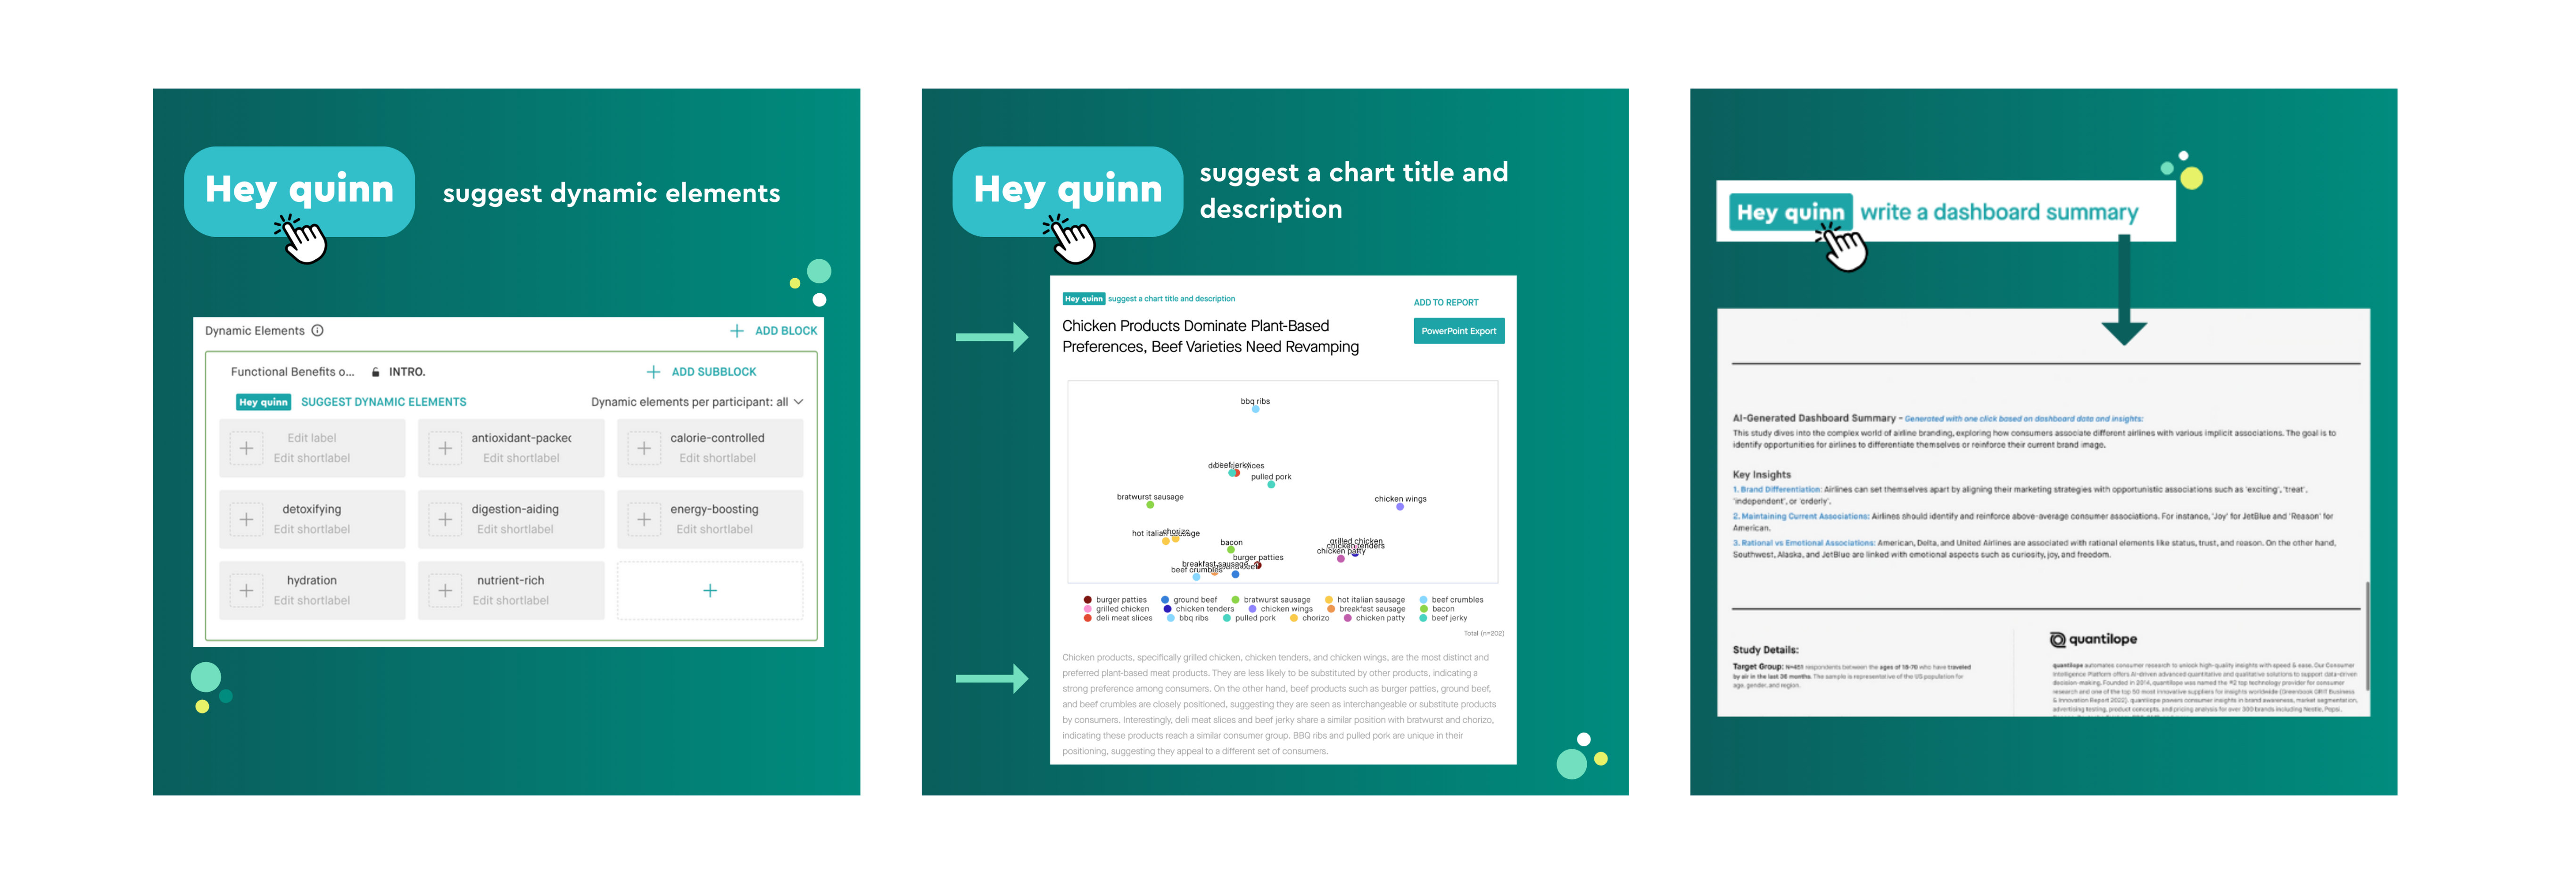
With upgraded AI study drafting and editing capabilities, quinn now manages the technical heavy lifting of the entire research process, ushering in the era of "Do-it-with-quinn" (DIQ).
.png?width=1015&height=944&name=survey-quinn%20(2).png)
With upgrades to quinn's AI model, saved chat histories, and expanded dashboarding capabilities, this release integrates quinn directly into quantilope’s Editor section. Here, quinn’s AI converts high-level objectives into structured questionnaires using advanced methods in minutes, while automatically reviewing the setup to eliminate manual errors and technical hurdles. The result is an iterative, conversational, and end-to-end research experience.
Key pillars of quinn's update:
- Advanced end-to-end AI integration: quinn now serves as the "nervous system" for quantilope’s Consumer Intelligence Platform. It maintains persistent context throughout the process - from the initial survey draft to AI-powered analysis and automated report creation.
- AI study creation & validation: Users can go from research objectives to structured research projects in minutes. quinn automatically reviews the setup to remove the risk of logic mistakes and the hassle of manual configuration, ensuring a seamless launch.
- Real-time refinement: Within the platform's Editor, new quinn Action Buttons allow for one-click improvements to question phrasing. Meanwhile, persistent chat allows researchers to "interrogate" their implemented logic or request technical clarifications iteratively and in real-time.
To learn more about how quinn can support you throughout your projects, please reach out to your quantilope team!
Linked Implicit Association Testing is now in our new Editor and Analyze - November 2025
quantilope's Single Implicit Association Test (SIAT) and Multi Implicit Association Test (MIAT) are now available in our platform's new Editor and Analyze sections, allowing for Linked Implicit Testing!
All features of our SIAT and MIAT remain the same as our legacy platform, but users can now leverage these advanced methods when working in our new version of the platform.

Linked Implicit Analysis lets you compare results from two or more implicit tests (like SIAT or MIAT tests) at the same time. To do this, a survey needs at least two implicit tests and at least one set of identical dynamic blocks that appear in both tests. You can mix and match whichever tests you want—two SIATs, two MIATs, or one of each.
A common use case for Linked Implicit would be to compare a product category to specific brands (for example, testing how people feel about an entire category like "soft drinks" versus specific brands within it). Another common use case would be before-and-after measurements (i.e. testing brand perceptions before and after people see an advertisement, in two separate Implicit Tests).
To learn more about quantilope's Implicit Testing, please reach out to your quantilope team!
Check out quantilope's CEP Generator! - October 2025
quantilope's CEP Generator is now live on our website!

As the foundation to any Better Brand Health Tracking (BBHT) study, Category Entry Points (CEPs) are the wants, needs, and occasions that bring consumers to go out and shop for a product/service in a particular category. They represent the "why" behind a purchase, encompassing everything from a functional need ("I'm hungry") to an emotional desire ("I want to feel pampered").
Knowing the undeniable impact CEPs and BBHT have on a brand’s growth and success, we knew we couldn’t let any brands miss out. That’s why we built our CEP Generator – a powerful, yet accessible, tool that serves as a great starting point for any brand looking to deepen its understanding of consumer behavior.
How quantilope’s CEP Generator works:
- Simple & free access: Visit quantilope’s website to fill out a brief form.
- Tailored insights: Within the form, add information about your specific category or industry.
- Instant results: quantilope’s use of AI leverages marketing science and research expertise to generate a list of 35 initial CEPs; these are specific to your category based on your input form.
- Delivered directly to your inbox: You'll receive a detailed PDF report of your custom CEPs directly in your email inbox.
To learn more about the CEP Generator, please reach out to your quantilope team!
Dynamic End-to-End Looping and Sequential A/B Testing is Live! - October 2025
quantilope's platform now offers automated looping functionality and Sequential A/B Tests!

Within a quantilope survey, you can now repeatedly loop respondents through a series of questions without worrying about complex programming logic.
With this end-to-end automation, enjoy:
- Dynamic loops based on previous survey logic: Piping logic will automatically route respondents through specific groups of questions based on their previous survey answers.
- Automated cross-comparison: Quickly and easily compare results across all looped items (concepts, brands, ads, etc.) within a single chart for clear and actionable next steps.
- Automated Sequential A/B Tests: Using looping functionality, Sequential A/B Tests let you know which concept performs best, with respondents reviewing each concept one after another in a 'loop'.
To learn more about looping and Sequential A/B Testing, reach out to your quantilope team!
Flexible Time-Based Analysis is live! - June 2025
quantilope's Flexible Time-Based Analysis now allows users to visualize their data by more than just the standard 'wave' timeframes!

Now, users can create custom timeframe tracking charts that better help them identify meaningful trends and answer key business questions (such as a product's seasonality or the impact of an ad campaign).
Flexible Time-Based Analysis means users can now view their data by:
- Standard wave-over-wave comparisons (wave 1 vs. wave 2 vs. wave 3)
- Incremental/calendar-based time splits (weeks, months, quarters, years, etc.)
- Custom timeframes (e.g., June 1st to July 15th)
Like our standard wave-over-wave tracking that users are accustomed to, Flexible Time-Based charts will automatically update as each designated timeframe passes (i.e., each week for a weekly-based chart or each time a custom timeframe passes).
To learn more about Flexible Time-Based Analysis, get in touch with your quantilope team!
New data analysis capabilities with Open-Ends Intelligence - June 2025
quantilope's Open-Ends Intelligence capabilities are now live, empowering users to get more out of their open-ended survey feedback!
This rollout includes 5 key features that make leveraging open-ends easier, faster, and more customizable:
- New and improved Topic Analysis: Improved AI-powered topic modeling including customizable topics and compatibility across 30+ languages!
- quinn Open-Ends Explorer: Ask our integrated AI co-pilot, quinn, to dive into your open-ended feedback for specific themes or verbatims; ask quinn to narrow down feedback by segments too!
- Topics as Variables: Use topics from your Topic Analysis to create custom variables that you can use in analysis just like any other survey variable (split-by variables, sample group creation, etc.)
- Topic Tracking: Track topics/themes over time by splitting your Topic Analysis data by any time period you wish (waves, weeks, months, etc.)
- Open-End AI probing: Ask for follow-up open-ended feedback in real-time, while respondents are still live in the survey

This rollout allows quantilope platforms users to do more with their open-ended responses, without requiring more manual work.
To learn more about our Open-Ends Intelligence, get in touch with your quantilope team!
QR code survey entry is now live! - May 2025
quantilope survey respondents can now begin participation by scanning a QR code!
Find this new feature in the Field --> Entry Link section, with the button labeled "QR Code" (next to the entry link URL):

^ Clicking on this QR code button opens a screen with the actual QR code image:

These two-dimensional barcodes can be easily integrated into printed materials and digital displays, making survey participation even easier.
To learn more about our new QR code entry feature, get in touch with your quantilope team!
A new version of our Survey Editor is here! - May 2025
quantilope's Survey Editor section of the platform has a whole new look and feel, with improved functionalities and a better user experience!

Our new Survey Editor follows our recent Analyze section update, as part of our overall 'App 2.0' project to improve quantilope's Consumer Intelligence Platform and create a better foundation to grow and quickly innovate.
The new Survey Editor is not only sleeker and more modern in style, it also uses state-of-the-art technology for improved platform performance, scalability, and maintainability. All of these updates make it even easier for users to work with their study, customize settings, and make edits - even for more complex projects.
Below is a sneak peek of the new Editor section, with a convenient sidebar editing window (rather than the clickable gears in our legacy version of the Editor section). 
As of now, all existing question types (e.g. single select, multi-matrix, etc.), all question-specific settings, and A/B Testing are live for our new version of the Editor section.
We are working to roll out all features and methods on the new version, but until then, users can easily toggle between our legacy and new versions of the Editor to avoid any study holdups (as shown below):

To learn more about our new version of the Survey Editor, get in touch with your quantilope team!
quinn Chat is live! - March 2025
In addition to generating survey inputs, chart headlines, and dashboard summaries with just the click of a 'Hey quinn' button throughout the platform, quantilope users can now communicate with quinn through a chat window for more customized, advanced research guidance. 
Lean on quinn to empower, guide, and inspire you throughout your entire end-to-end advanced research project.
For example, quinn Chat can support you by:
- Uncovering key project insights in seconds
- Empowering specific method expertise
- Building charts and report groups
- Curating entire reports & dashboards
- Inspiring suggestions for storylines
- Analyzing real data (descriptive, open text, tracking)
- Generating outputs in most common languages
Below are a few more specific examples of prompts to ask quinn Chat:
-
"Would you recommend using a specific method in addition to the questions in the survey now?"
-
"How does group X differentiate from group Y?"
-
Could you translate the MaxDiff key findings in Spanish and add them into the dashboard?"
quinn Chat is available in the new Analyze, Reporting, and Dashboard sections of the platform. Simply look for the quinn icon to open up a chat window for all your specific research questions and requests.
To learn more about quinn Chat, check out the 2-minute demo video here or reach out to your Research Consulting team!
New charting options for BBHT's Mental Availability and Mental Advantage Analyses! - January 2025
Visualize and analyze your Better Brand Health Tracking data like never before with new charting capabilities for Mental Availability and Mental Advantage analyses.
Dive even deeper into your brand health metrics using scientifically-proven and actionable brand metrics based on Category Entry Points.
With our new Mental Availability analysis charting options, focus on a single brand over time or split by key groups (e.g., buyers vs. non-buyers) to understand exactly which audience is driving Mental Availability for your brand. Easily identify trends and opportunities for improvement to inform your campaigns and fuel brand growth. These new charts allow you to visualize Mental Availability KPIs, including Mental Market Share (MMS), Mental Penetration (MPen), Network Size (NS), and Share of Mind (SoM), across multiple waves.

As for Mental Advantage analysis, use new charting capabilities with enhanced visualizations to identify areas of strength and weakness. Focus on a single brand and explore its Mental Advantages and Disadvantages across different groups or track changes over time (waves). New split chart options make monitoring your Advantages over time easier than ever, enabling you to quickly pinpoint specific areas for campaign focus.
These new charting options for Mental Advantage analysis empower you to:
- Identify trends, opportunities, and areas for improvement more easily
- Develop more effective campaigns based on deeper insights
- Gain a more granular understanding of your brand's and Mental Advantage performance

Ready to take your Better Brand Health analysis to the next level?
Contact your Research team lead to learn more about these new charting options for Mental Availability and Mental Advantage analyses!
Expanded library of pre-built survey templates - December 2024
New & enhanced Analyze section for tracking projects - October 2024
Multi-language (single & tracking) projects are now available in the latest version of our Analyze section on the platform!
With this update, multi-language tracking clients can now leverage the platform's improved Analyze features such as:
- The ability to edit tracking charts directly within final reports and dashboards (rather than having to go back to the Analyze tab).
- Live chart filters applied directly in shared reports and dashboards.
- A responsive design that dynamically adapts to any screen size.
- A refreshed color palette for a consistent and familiar experience throughout the platform.
- Streamlined navigation and accessible components make it easier than ever to explore your tracking project data.
See below for a peek into what this new section looks like!

Navigate to the new version of Analyze using the dropdown on the platform as shown below:

Please reach out to your research team lead with any questions or feedback!
New and improved Topic Analysis is live - September 2024
quantilope's new Topic Analysis now lets users enjoy less manual work for customized topics, better actionability from Topic Analysis chart outputs, and the ability to input most languages for the analysis - without needing to change language settings.
Below is an example from quantilope's syndicated study in the Body Wash category - showing the creation of a custom topic ' Strong smell' :

As another example, below is what an output now looks like with our new and improved Topic Analysis, showing clear and actionable topics:

Topic Analysis is available to all clients that have accepted Microsoft as a data processor, and is available on both Analyze 1.0 and Analyze 2.0 versions of quantilope's platform, though certain new features are exclusively available in Analyze 2.0.
To learn more about this new analysis for open-ended text questions, reach out to your Research team lead!
quantilope's Pre-Survey Defense Module is Live! - August 2024
Conjoint Design Extensions are Live! - July 2024
Two new advanced methods for CI Tracking clients: Mental Availability analysis + Mental Advantage analysis! - July 2024
quantilope has added two new methodologies to its largest suite of advanced methods - providing platform users with 15 total methods to choose from in their consumer research studies.
These two new methods: Mental Availability analysis and Mental Advantage analysis are available for CI Tracking clients to better understand their brand from a consumer lens. Both methodologies derive from the work of Professor Jenni Romaniuk (of the Ehrenberg-Bass Institute for Marketing Science) and are rooted in scientific research - making them more actionable than typical tracking funnel metrics.
As with all other quantilope methods, Mental Availability analysis and Mental Advantage analysis are automated so platform users don’t have to worry about any complex, manual calculations. Below is a bit more on each method:
Mental Availability:
Discover how readily your brand comes to mind for consumers in specific buying scenarios.
Using the results from an implicit pre-test (SIAT) to determine the top 20 Category Entry Points (CEPs) for your study, respondents will select which of those CEPs 'fit' with your brand (and all other competitors included in your study). The result is 4 key Mental Availability metrics:
- Mental Market Share: How present a brand is in consumers' minds with regard to all Category Entry Points (CEPs) and brands.
- Mental Penetration: How many consumers have at least some mental availability of a brand.
- Network Size: How broad/varied category associations are for each brand in your category.
- Share of Mind: What other brands customers are thinking of in addition to a specific brand (among those with MPen for the brand of interest).
Learn more about Mental Availability here!
Mental Advantage:
Identify how your brand's actual association with a CEP/brand attribute deviates from the expected association - given your brand's size and the commonality of that CEP/attribute for your category.
This analysis points out areas where a brand might want to shift their focus away from (if they already have a strong advantage) to make room for other areas of growth. It also lets brands know where to maintain associations/CEPs that are currently performing as expected. These recommendations are clearly visualized using a heat-map type of chart (as exemplified below from quantilope’s Body Wash BBHT study):
Learn more about Mental Advantage here!
For more on Mental Availability and Mental Advantage analyses, reach out to your CS team lead!
quantilope's Survey Guardrail System Is Officially In Place - June 2024
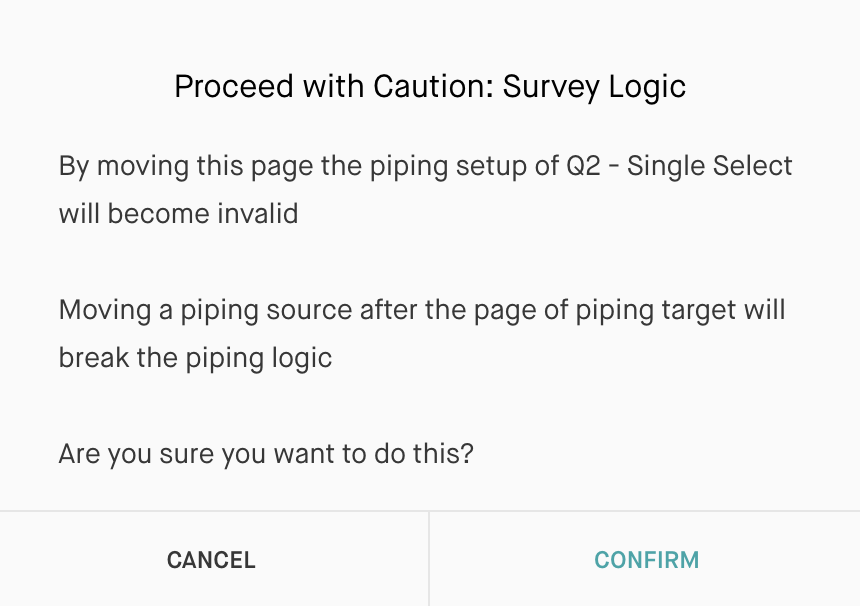
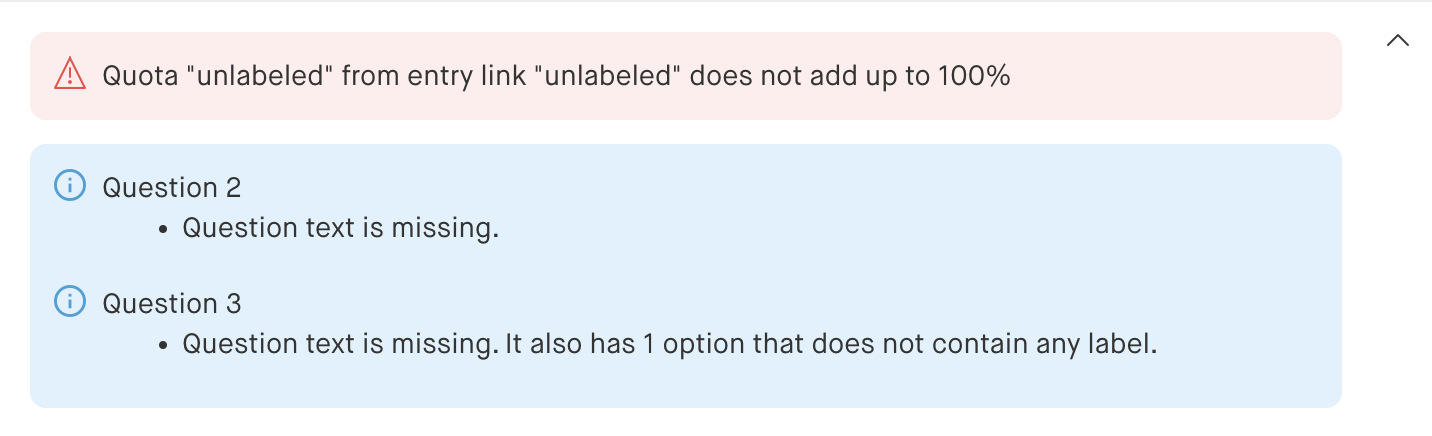
quantilope's Survey Guardrail System is a powerful new feature designed to help platform users create surveys that are logically sound and error-free.
Using two-tiered warnings, the Survey Guardrail System provides preventative and informative alerts about potential issues within your survey:
- Preventative Warnings:
- Real-time alerts in the Survey Editor notify you of potential problems as you build your survey, helping you avoid errors from the start.
- Real-time alerts in the Survey Editor notify you of potential problems as you build your survey, helping you avoid errors from the start.
- Informative Warnings:
- A comprehensive summary of potential issues is displayed at the top of the Field section, ensuring you're aware of any remaining problems before launching your survey.
- A comprehensive summary of potential issues is displayed at the top of the Field section, ensuring you're aware of any remaining problems before launching your survey.
To learn more about quantilope's Survey Guardrails, get in touch with your CS team lead!
New Data Cleaning Tool: Copy & Paste Text Flag - March 2024
With this latest data cleaning flag, automatically identify respondents who have copy/pasted a substantial portion of their open text / open table feedback into your survey (rather than typing in their own authentic responses).
This cleaning flag adds to quantilope's existing data cleaning capabilities (straight-lining, speeding, etc.) to ensure the highest quality of responses within your study.

To learn more about this data cleaning flag, reach out to your CS team lead!
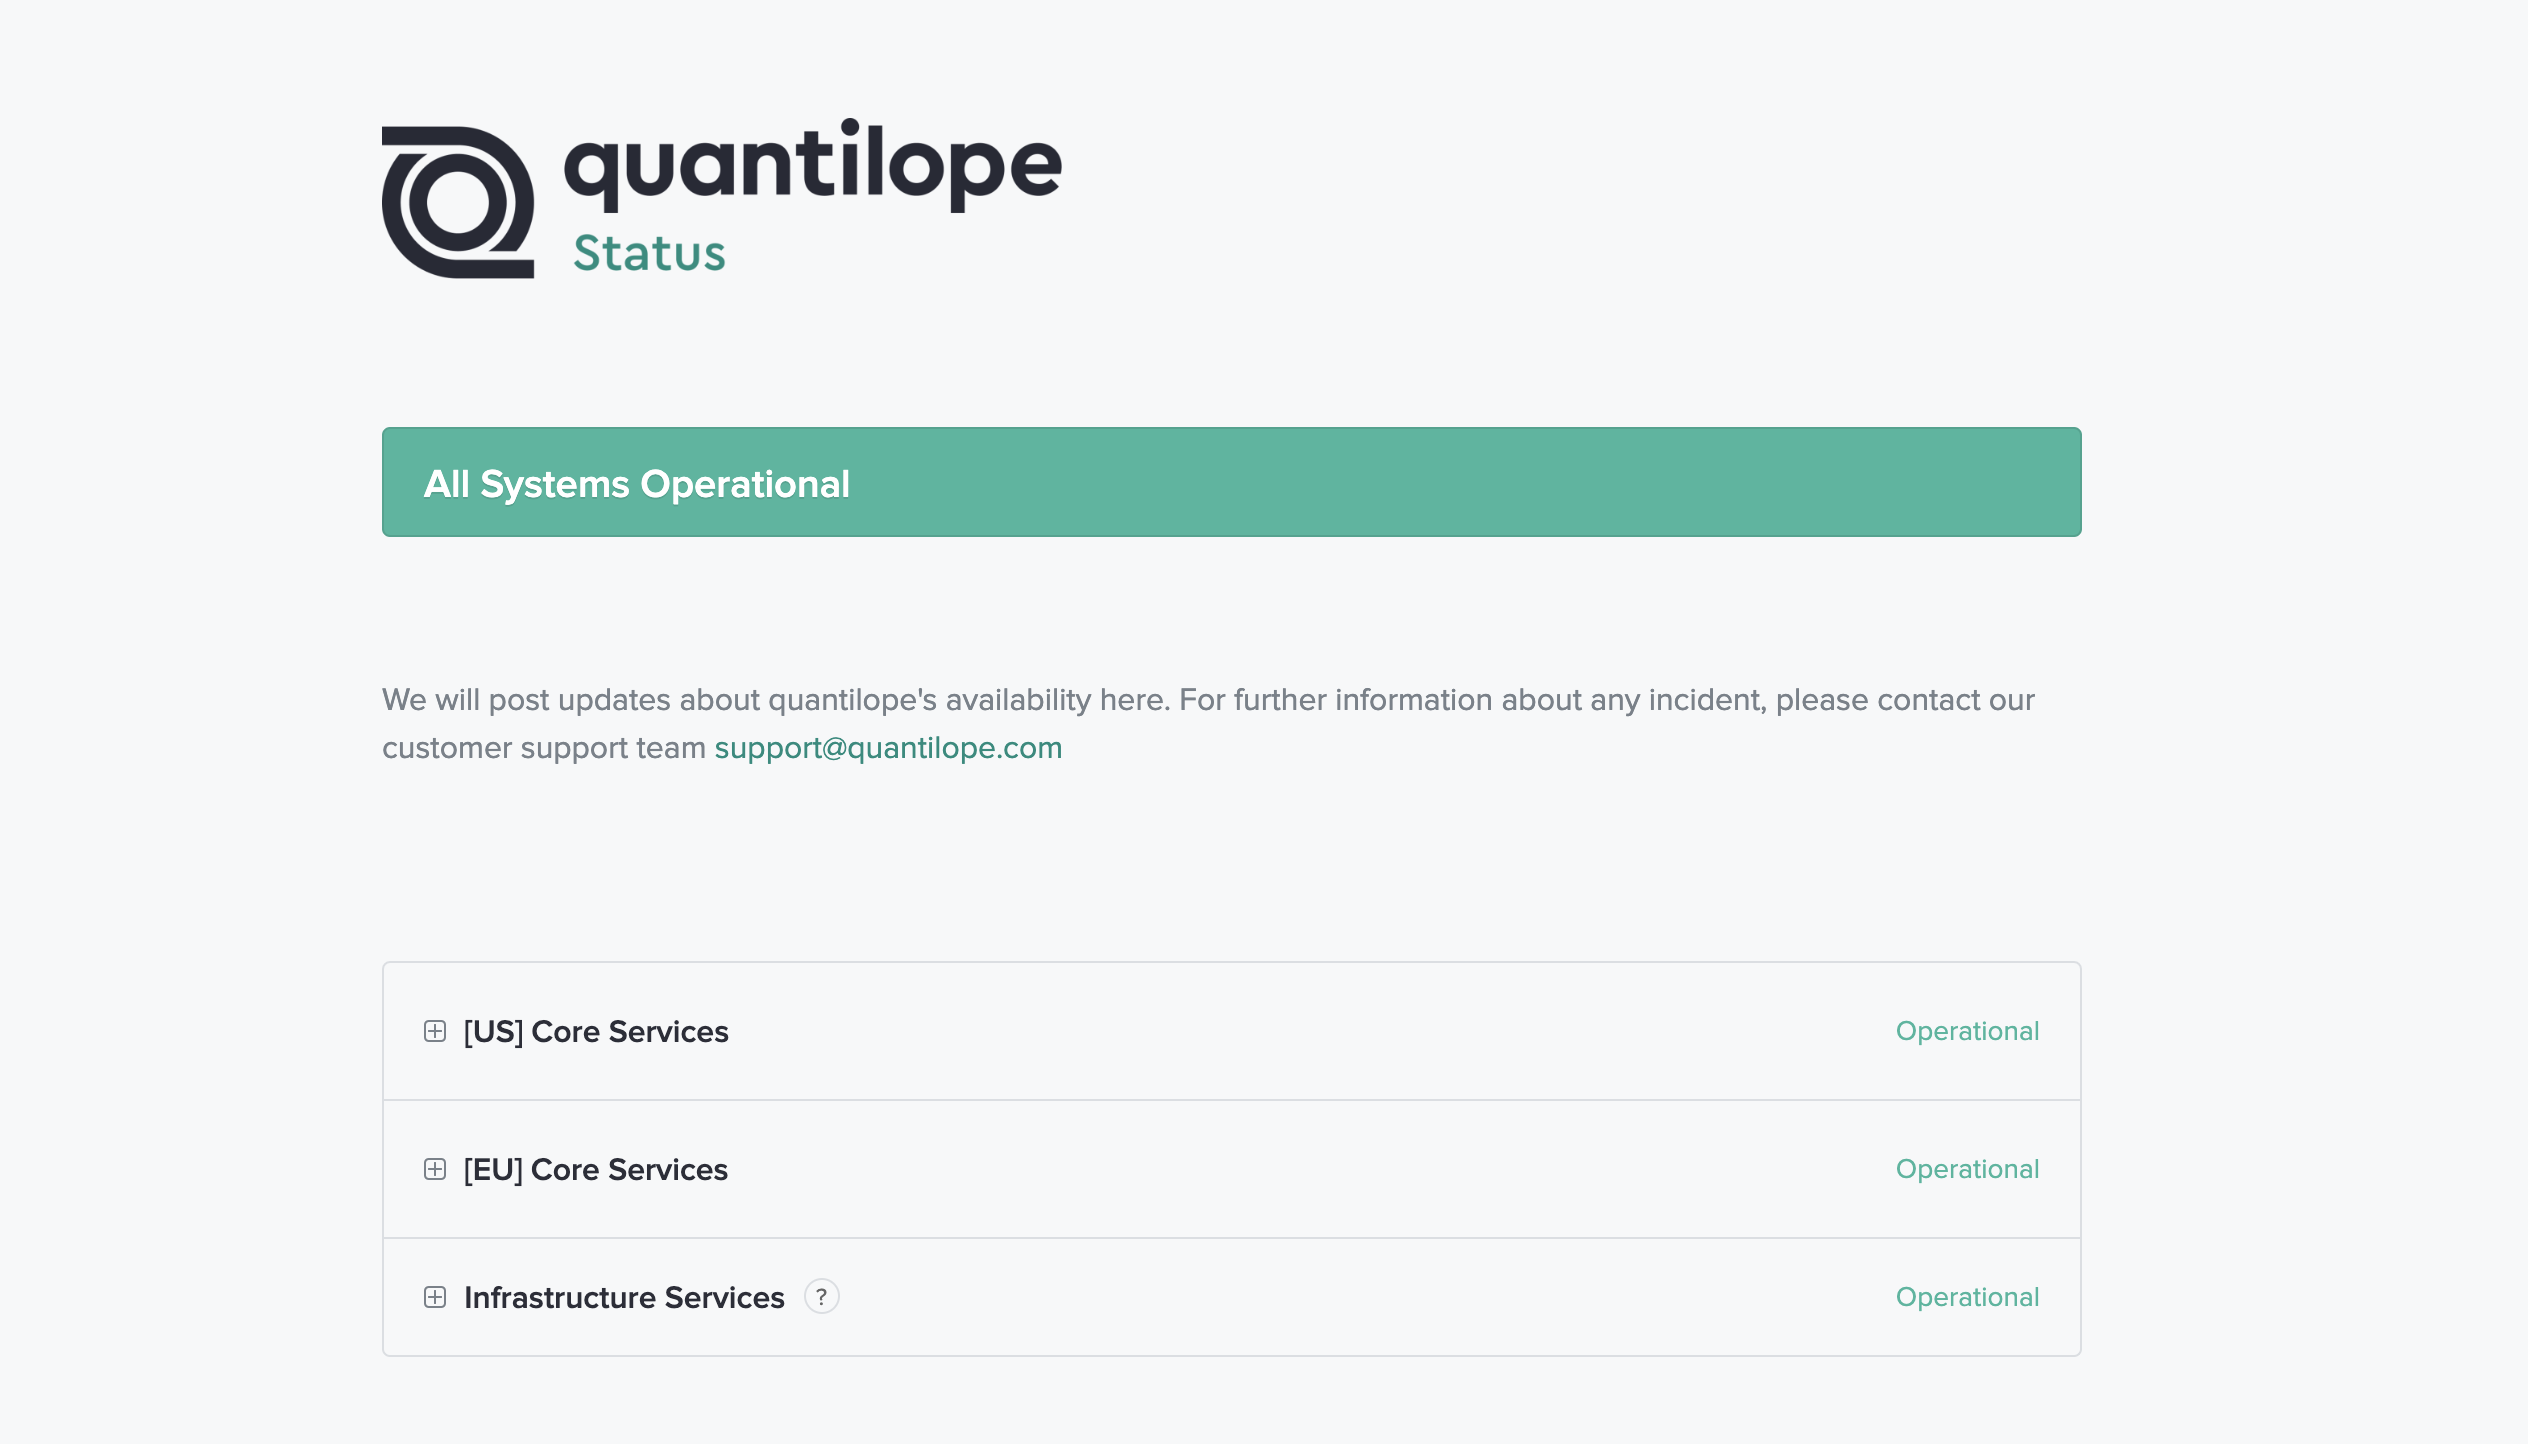
quantilope's Status Page Is Live! - March 2024
https://status.quantilope.com serves as a real-time monitor for the status of quantilope systems.
Here, quantilope users can check in at any time to confirm the platform is running smoothly. This is helpful for users to know if any trouble they're experiencing is related to their own systems or the quantilope platform itself.
For more information on this, reach out to your CS team lead!
quantilope's Auto Translations Feature Is Live! - March 2024
New Better Brand Health Tracking Metric: Mental Advantage - February 2024
Upon releasing our Better Brand Health Tracking solution, we focused on four key analyses known as Mental Market Share, Mental Penetration, Network Size, and Share of Mind. Now, we introduce another key analysis of BBHT known as Mental Advantage.
In her book, Better Brand Health, Research Professor Jenni Romaniuk (of the Ehrenberg-Bass Institute) highlights how Mental Advantage analysis accounts for two very important factors influencing brand-attribute-associations among category buyers: past brand buying and prototypical brand buying.
- Past brand buying:
When a consumer buys from a brand, they are far more likely to associate that brand with any given attribute than a consumer who has never purchased from that brand before. Because of that, the big-name, global companies within a category are going to get more attributions than smaller ones (giving them an unfair advantage when directly comparing them to smaller brands). - Attribute commonality:
Attribute commonality refers to the associative strength an attribute has with a given category. Some attributes are more strongly associated with a category, like 'to protect wounds' for bandages or 'to call friends' for smartphones; these common, or, 'prototypical' attributes will be more strongly associated with different category brands than less common/prototypical attributes, making those other attributes appear less important for brands to consider (when in reality, they may be areas of great potential for a brand).

To learn more about Mental Advantage analysis, get in touch with your customer success team lead!
quantilope Earns ISO 27001 Certification - December 2023
quantilope Launches quinn! quantilope's AI Co-Pilot for Advanced Consumer Research - December 2023
To continue offering the most competitive and advanced insights platform, quantilope is proud to introduce quinn, its market-leading AI Co-Pilot integrated directly within the platform!
quinn leverages Generative and Synthesizing AI to provide inspiration and guidance when developing advanced method inputs, analyzing data charts, and summarizing dashboard insights. Over time, quinn will continue to expand its list of AI-driven features and tools to make researchers' lives that much easier.
 To learn more about quinn and the available AI features and tools, get in touch with your CS team or check out this page.
 Typing Tool Integration - August 2023
Multi Implicit Association Test (MIAT) - June 2023
MIAT (Multi Implicit Association Test) is our new naming convention for the previously-named MAT method, which is used to test implicit associations around brands, products, or categories in a competitive environment.
MIAT, along with a changed name, has enhanced user experience with an easier setup and a better training module, improved calculations for weighted response times, and a more intuitive/streamlined participant view.
For clients or prospects who never heard of or used MAT before:
MIAT is quantilope’s way of testing consumers' subconscious associations toward multiple brands, products, or categories at once. It is grounded on the speed of reaction time, uncovering implicit associations participants may not even be aware of, and is beneficial for clients looking to run a category brand audit, optimize their product line, or test visual elements such as logos.
In the MIAT, participants choose which of the static elements fits best to the displayed association. Unlike any other tool on the market, this implicit method is also seamlessly integrated into our mobile-first participant view. The new interface allows researchers of all experience levels to set up a MIAT in just a few minutes.
As shown below, quantilope’s MIAT is…
- The only multi implicit test on the market to be mobile-ready and automated
- Cost-efficient by testing multiple elements at the same time
- Simple to set up and run for any research skill level
To learn more about MIAT and how you might leverage it for your own business needs, get in touch with your dedicated research consultant!
PowerPoint Export is Here! - June 2023
Introducing quantilope's Modernized Brand Health Tracking Template - May 2023
Can you relate to any of the following?
- Current brand tracking solutions are not efficient (in terms of cost or time)
- Brand tracking outcomes aren’t always actionable or relevant
- We need our tracking study to tell us more about our brand than just awareness or usage
If so, you’ll be excited to learn more about quantilope’s new Brand Health Tracking solution, now available within the Consumer Intelligence Platform.
![]()
quantilope’s new brand health tracking model is based on the acclaimed work of Professor Jenni Romaniuk, of the Ehrenberg-Bass Institute of Marketing Science (author of Better Brand Health and co-author of How Brands Grow). The model is centered on the idea to design for the category, analyze for the buyer, and report for your brand. It works by leveraging two modernized brand health tracking concepts known as Category Entry Points (CEPs) and Mental Availability.
Category Entry Points are essentially the ‘cues’ that make a consumer think about a specific buying scenario - such as thinking to order a soda at a restaurant, bringing soda to a neighbor’s BBQ, or buying soda for a family party. Mental availability is what makes consumers think of your brand in those buying scenarios (i.e. ordering Coke at a restaurant or buying Pepsi for a party).
What does all this mean for you? quantilope clients can improve their brand health tracking all while saving time and money through the use of technology and automation (with a pre-templated questionnaire, report, and dashboard).
In summary, quantilope users who leverage this new approach to brand health tracking will have access to:
- A templated and research-consultant-guided pre-study to prioritize relevant buying situations (CEPs)
- A templated and research-consultant-guided brand health tracker survey based on the pre-study, including pre-built report charts and a templated dashboard
- Real-time tracking insights for instantly-actionable decisions
Check out what our brand health tracking templated dashboard looks like in our Soda tracking study here (with a focus on Diet Coke) or read more about this new approach here.
Still have questions? Reach out to your CS representative to chat more!
New Count-Based MaxDiff Advanced Method Course - April 2023
Single Implicit Association Test (SIAT) - March 2023
Our new Single Implicit Association Test (SIAT) is here!
SIAT (Single Implicit Association Test) is our new naming convention for the previously-named SAT method. Along with the new title, we've enhanced the user experience with an easier setup, a better training module, and improved calculations for weighted response times. These SIAT improvements make this advanced implicit method even better than it was before.

Read more about SIAT here.
Introducing the quantilope Academy! - February 2023
Open-ended data cleaner flag - February 2023
Mobile Conjoint - January 2023
quantilope survey participants can now take conjoint on the go!
Using a state-of-the-art design for mobile applications, users can now program a choice-based conjoint for mobile participants (in addition to the already-available desktop and tablet compatibility).
To enable this new feature in Survey 2.0 projects, click 'customize survey' in the survey preview window. Then click on devices, and toggle on 'allow smartphones'.
This will allow mobile users to see the question text and 2-3 alternatives shown at once with up to 6 attributes shown for each alternative.

Reach out to your CS team to learn more about our new mobile conjoint compatibility!
Automated inColor showreel generation - November 2022
Creating showreels with inColor just got a whole lot easier!
inColor users can now automatically generate a showreel:
- using responses filtered for a particular emotion
- using specifically-selected responses
- using all responses
These updates mean users no longer have to sift through video feedback for certain sentiments or responses to include in a showreel, this is now done automatically based on your preferred criteria.
If no responses include a selected emotion for automated showreel generation, users will see a notification informing them of such.

To learn more about inColor's automated showreel generation, get in touch with your CS team or check out the informational page here.
Introducing: Topic Analysis - November 2022
Topic analysis is now available for open-ended questions, providing the option to cluster individual sentences into overarching topics or themes with similar meanings.
This provides a quick visualization of open-ended content, without having to read through each sentence individually. This analysis is automated, though users have the option to review and customize topics/themes as they see fit.
Learn more here.

Survey 2.0 in open beta - November 2022
Have you seen quantilope's survey 2.0 with an all-new user experience and design?
This mobile-first version of the survey platform improves response quality for an even more engaging and effective respondent experience.
Aside from an improved look and feel, respondents can now review their answers with backward survey navigation - ensuring final answers are truly reflective of consumer sentiment.
Reach out to your quantilope team to try it for yourself!

New survey templates now available - July 2022
It's now easier than ever to streamline your research process with quantilope's new and updated survey templates built directly into the platform.
Users can simply select a template that relates to their research study (i.e. brand positioning, concept testing, etc.) and all core questions related to that type of research study will generate automatically.
quantilope's templated surveys work the same way as those built from scratch - giving users the option to further customize their study however they wish. Simply drag & drop any additional questions or advanced methods from the pre-programmed library.
Many of the templates go even further to include prebuilt dashboards, helping you to create final insights reports in just minutes.
Read more about the templates here.

New emotion analysis and translations with inColor - July 2022
quantilope's video-based qualitative research solution just got more versatile.
You can now rank emotions when analyzing expressions with multiple interpretations using inColor's enhanced emotion analysis AI.
In addition, you can now automatically translate video captions into 11 languages to easily develop showreels for international studies.
Request a demo here.

New response table - April 2022
quantilope's new response table allows users to review and clean open-end responses from open-text and open-table survey questions, without needing to export a raw data file.
With this update, verbatim answers are now shown in a table directly under a word cloud chart in the 'Analyze' tab of the platform, along with each verbatim's associated respondent ID.

To learn more, or to answer any questions about this new response table, please reach out to your Customer Success representative.
New chart display features - March 2022
Our chart settings just got even more intelligent, organized, and easy to use!
Rather than clicking into the settings gear tab and having to scroll up/down to see changes implemented on a chart, users will now enjoy sidebar navigation for all chart settings, allowing them to make changes to the data labels, text size, axis scales, significance testing, and more, while still having a clear view of the chart undergoing these changes.
This update also makes it easier for users to change the colors of the bar charts, while still having the sidebar settings visible (previously, these two settings were split between two different screens).
Here's what users will now see in the app when changing their color and chart settings:

While these are all fully customizable settings, and can easily be 'applied to all', recent updates to our chart features also change the default settings to be more aligned with commonly-heard feedback. Specifically, the default decimal value is now set to zero instead of one, and the default text size has been increased from 12 to 14.
Lastly, this new sidebar navigation layout leaves room for even more feature improvements to our platform's charting experience in the future, which can be added with a scroll function to this navigation bar.
We hope these updates to our charting experience create a better overview for our users as they customize and manage their chart data.
To learn more, or to answer any questions about these new chart settings, please reach out to your Customer Success representative.
Manual chart sorting - December 2021
quantilope has recently implemented a new feature to our charting capabilities: manual data sorting.
This new feature allows quantilope users to drag + rearrange any singular data point within a chart as an alternative to sorting in ascending/descending order, or alphabetically. With this new feature update, users are able to make their charts much more customizable to their unique brand stories.
Users are able to combine this new chart sorting feature with the existing sorting capabilities already integrated into our platform. For example, a user can start by sorting a bar chart in ascending order (1,2,3) then ALSO drag a particular data point to the top of that chart.
An example of this is shown below, where data is sorted in ascending order, but the top brand has been manually relocated to the top position (perhaps to highlight the client's own brand in a competitive landscape):

This new feature is currently available for bar charts, column charts, donut charts, pie charts, semi-circle charts, stacked charts, and top/bottom charts. In the future, we aim to roll this out for other charts such as 'split-by' charts.
Please note: Manual sorting can only be done after all other chart settings are applied (such as decimal points, text size, etc.) and after you’ve completed your preferred overall sorting (i.e. 123 order).
To learn more, or to answer any questions about manual chart sorting, please reach out to your Customer Success representative.
New multi-matrix chart option now available - December 2021
There is a brand new chart type now available on our platform in the analyze section for Multi-Matrix questions.
This chart creates a fifth charting option for multi-matrix questions, in addition to the existing bar, column, stacked bar, and stacked column charts.
This new chart allows users to view the data in a 'profiling' option so that you can compare different values within a multi-matrix chart easier than ever before. Further, for questions where there is piping logic, we now have a conditional base (which is different from simply hiding 'n/a') that can be applied to the entire chart and with respect to each unique statement (not just one statement at a time).

To learn more about how you can leverage this chart option, or to answer any questions you may have, please reach out to your Customer Success representative.
New and improved word cloud functionality - November 2021
Our word cloud just got smarter thanks to recent improvements to our open-text analysis.
With these feature improvements, the word cloud now automatically detects your respondent's language, corrects spelling errors, and merges similar words to get relevant insights even faster, without the need for manual adjustments.
For example, automatic survey language detection means users no longer have to sift through results and remove meaningless words from the data set.
And, by merging similar words (accounting for typos, or different tenses of the same word like 'studying' and 'studies'), respondents can count on the most accurate output to use in their analysis.

Once you've generated your word cloud output, users can even tailor this further by choosing to exclude certain words. Say for example you are a brand that sells chocolate. The word 'chocolate' will probably come up a lot in your word cloud, but it's not all that interesting for your analysis. By electing to remove this word, other sentiments such as 'delicious', 'expensive', or 'indulgent' will become more prominent.
To learn more, or to answer any questions about these new open-text analysis features, please reach out to your Customer Success representative.
Launch of new automated method: Segmentation - October 2021
quantilope’s Insights Automation platform is growing...with the release of our latest advanced method offering: segmentation! This marks the 13th automated, advanced method available on quantilope’s platform, empowering our clients to define where to play, and how to win.
A Need-based Approach:
Our newly available segmentation method is based on consumer needs, rather than demographics, behavior, or psychographics (see graphic below). Need-based segmentation is considered the ‘gold standard’ in segmentation research. That’s because need-based segmentation allows clients to deeply understand the motives that impact future behavior, and/or areas to improve on. This sets up a foundation to develop a multitude of products that cater to different consumer segments and their true needs.
quantilope’s ability to segment on consumer needs, yet still having the power to automatically profile the segments on demographic, behavioral, or psychographic data makes this an ‘all-inclusive’ approach to segmentation.
.jpg?width=1920&height=880&name=needbased-chart-03%20(1).jpg)
Easy to Use:
Segmentation, like all other advanced methods, can be added to a survey with a simple drag + drop. The method uses a MaxDiff to capture consumer responses to need statements, which are then analyzed through a series of sophisticated, machine learning algorithms on the backend.
Through the power and ease of automation, quantilope’s segmentation captures insights at a fraction of the time it takes with other vendors. It is intuitive in nature yet sophisticated in results, and provides guaranteed quality without risk of manual errors.
Potential Use Cases:
- Align communication/advertising strategies
- Test/prove qualitative personas
- Develop product/brand innovations
- Align brand/pricing strategies
...and so much more!
For more on quantilope’s automated segmentation, and the rest of our 12 advanced methods, check out our website’s method page.
New log-in page & two-factor authentication - April 2021
quantilope implemented Auth0 to make the platform even more secure. The new updates are supporting user authentication and authorization.
In the course of this, there is also a new log-in page.
It only differs in design. All existing functionalities remain the same.

From now on you are also able to enable two-factor authentication (2FA) for your organization.
2FA provides a method to verify a user's identity by requiring them to provide two pieces of identifying information. This ensures that only valid users can access their accounts even if they use a username and password that may have been compromised from a different application.
If you have any questions about Auth0 or would like to enable two-factor authentication for your organization please reach out to your Customer Success representative.
Filter feature for quick and lean SPSS and raw data exports - February 2021
You can now decide which survey and participant data you want to export when creating a raw data or SPSS export.
To do so, click on the export button as usual and select the desired export.

You then have the option to select the data you'd like to include in your export by selecting the corresponding boxes. Selection options may include participant status, tracking waves, and language/region, depending on the type of project.

Redesigned file upload - December 2020
Whenever you want to upload an image or video within your project, you will now find a more simple and clean file menu.
You can simply drag and drop your file to upload it or select the desired source of your file on the left side of the menu.

Source options include the upload of a file from your own device or google drive, entering a link (URL), or using the web search feature to find an image online.
After uploading your image, you have the possibility to further edit (crop, circle, or rotate) it.

Adjust formulas by using words - September 2020
You are now able to use words when adjusting formulas in addition to characters ("&&", "||", "!").

Simply type in "and", "or", or "not" according to the desired formula. After you're done, these operators will turn into colored badges, making it easy to capture the formula.

Additionally, you can quickly change the direction of an operator by clicking the colored badge (e.g. turn an "or" into an "and").
For now, these formula enhancements work for the customer variable setup. Other parts of the software (sample, routing conditions) will be adapted in the upcoming sprints.
Add 'general comments' (in addition to survey comments) in the manage section - July 2020
In addition to the survey comments, you can now add general comments to better communicate with your team in the manage section.
While survey comments are directly linked to specific questions of your questionnaire, general comments can be used to communicate about general topics within your project.
By clicking Add New Topic you can create a new topic (e.g. next steps, quotas, reporting) and write comments directly related to the topic.

Click here to learn more about working collaboratively with quantilope.
Export your insights dashboard - July 2020
You can now export your Insights Dashboard into a PDF by clicking Export.
The PDF-export can be used to
- save the Insights Dashboard externally and, for example, store it in an archive
- enable an offline presentation of your insights
We recommend selecting "Single Page View" within your PDF reader (in Adobe you will find this setting under View/Page Display/Single Page View).
Automated prediction of the survey length - July 2020
With PREDICT LOI (length of interview) you can estimate the approximate length of your survey.

This gives you an idea of how long it will take respondents to answer your questionnaire, which is also useful for predicting the costs of the online panel.

After clicking PREDICT LOI, a small pop up window informs you about the average length of the survey as well as a range to cover different flows of your questionnaire (e.g. routing conditions).
Language selection screen for multi-country projects - June 2020
The new language selection screen enables your participant to choose the language they want to take the survey in.
Benefits:
- reduces administrative effort during the fieldwork
- empowers you to reach a broader target group (e.g. in countries where several languages are spoken)
- enables you to share the link in places where you do not necessarily know the preferred language of the participants (e.g. social media)
How-to:
- click language variations within the field section
- enable Language selection screen
- select the languages you would like to include to be displayed in the screen

Create 'to-do' lists using survey comments - May 2020
You can now turn your comments into tasks.
Simply mark a comment as a 'to-do' and once the task has been completed, you can check it off.
Using 'to-do's' you can quickly go back to your project to make sure your team has completed all outstanding tasks.

New comment feed in the manage section - April 2020
In the middle of the manage section, you will now find the comment feed where you will see all of the comments that have been left in the survey editor.
With just one click you can filter the comment feed to see your own comments or the comments that you’re tagged in right at the top.

New manage section for enhanced collaboration - April 2020
quantilope’s updated manage section will help facilitate collaboration with your team, enable you to manage project tasks and keep your project information all in one place.
On the right hand side you are now able to add information about the research background, objective, target group, etc.
You can also add attachments to your projects, like images, project briefings, or any kind of additional material that could be helpful for you and your team.

Mention research consultants to get quick support - April 2020
In addition to your colleagues you can now also tag quantilope support in comments.

Your assigned research consultant will receive a notification and can help you even faster.

Create multiple dashboards per project - March 2020
Sometimes one Insights Dashboard is just not enough! In multi-country projects, you may need an extra dashboard for a specific country. Or in tracking studies you might want to show insights from a single wave in its own dashboard.
And with quantilope's latest update, you are now able to create several Dashboards per project.

By clicking Insights Dashboards in the submenu of Report, you will go to a overview of your Insights Dashboards. In the overview, you are also able to create new Dashboards, rename them, create sharable links, copy Dashboards or delete them.

If you are working on one Dashboard and then want to return to the overview page, simply click on "Overview".

Password protection of dashboards - March 2020
You are now able to password protect your Insights Dashboards.
How it works:
1.) Go to the Insights Dashboard you want to protect and click on "Share"
2.) Select "Protect with Password"
3.) If required, edit the automatically set password

Once someone opens the shared link, they will be asked to enter the password in order to see the Insights Dashboard.

Conjoint optimal product chart - February 2020
Finding the optimal product attributes within your conjoint has never been that easy!
The new Optimal Product Chart shows at a glance, which product configuration maximizes the respective outcome. Instead of clicking through all possible attribute levels to find the optimal one, this chart gives you these insight quickly and directly.
You can switch the outcome between Share of Preference and Revenue, to see which attribute levels are needed to optimize the respective outcome given your competition.

Imported variables can now be updated - February 2020
You are now able to update previously uploaded imported variable files.
Typical examples of imported variables include the import of coded open-ended responses or additional participant information, e.g. membership of a particular customer segment. Updating variables is particularly useful in tracking studies when imported variables need to be adjusted for new waves.
To update a variable, simply download the current file(s) within the "Data Import" section at "Variable File Exchange", update it and import it again.

For more detailed information about our Imported Variable visit the Support Center.
Mentioning colleagues in comments - January 2020
You can now tag your colleagues in comments when working together on projects. Address your comments to specific people by marking them with @name, facilitating targeted and efficient collaboration.

Colleagues receive an e-mail notification when they are mentioned. Clicking "Go to the comment!" will lead you directly to the corresponding comment.
If you do not want to receive e-mail notifications, you can deactivate them in your profile settings at any time.
Copy a sample with all its conditions - January 2020
To make the definition of samples even faster, you are now able to copy your already defined samples.
Simply click the copy button in the Sample Overview and a copy of the sample with all its defined conditions will appear underneath the existing ones. Afterwards you can rename the sample as usual.
This is especially useful if you want to create several complex samples with almost similar conditions.

SAT goes mobile - December 2019
Our Single Association Test (SAT) is now also available for mobile devices. Participants completing a survey with an SAT can use their smartphones to complete the study, enabling brands to reach a wider target audience.
In the mobile view of the SAT, participants can indicate that a term "fits" or “does not fit” with a certain term (e.g. a category) by clicking in the left and right areas of the smartphone screen.

Updated sample menu in Analyze - December 2019
We implemented an even easier way to analyze your results by different samples.
In the optimized dropdown menu you can see an overview of the samples you’ve created with the corresponding sample size. You are also able to create a new sample or edit an existing sample with just one click.

Create color schemes per project - November 2019
In addition to the color setting per chart, you are now able to define your own color scheme in a project. With just a few clicks you can easily add corporate or product colors to your project and create an individualized visualization of your results.
After setting up the color scheme it will automatically be adopted for most of the charts within your project. The corresponding settings can be found in the Analyze section, next the Insights Settings menu.
